Code
library(readr)

data <- read_delim("student-por.csv", delim = ";", col_names = TRUE, show_col_types = FALSE)library(readr)
data <- read_delim("student-por.csv", delim = ";", col_names = TRUE, show_col_types = FALSE)For this project, we use the Student Performance Dataset from the UCI Machine Learning Repository. This dataset was collected by Paulo Cortez and Alice Silva from the University of Minho. It contains data on secondary school students from two Portuguese schools, providing attributes such as demographic, social, and academic performance information. The dataset includes two separate files for performance in Mathematics (student-mat.csv) and Portuguese language (student-por.csv). This time, we just use student-por.csv for the project.
The data is stored in CSV format, making it easy to process with tool R. It includes 30 attributes for each student, such as gender, age, family background, and academic grades. The datasets have dimensions of 649 rows for Portuguese language. The data is static and does not undergo updates, as it was collected for a specific research study in 2008.
Potential issues with the data include: Imbalanced attributes, such as few students in certain categories (e.g., higher education aspirations). Missing values, although these are not explicitly documented, will require investigation. Correlation among features, such as multiple related attributes about family and study time.
We imported the data using the RStudio by downloading the CSV files directly from the UCI Machine Learning repository.
Link for the dataset: https://archive.ics.uci.edu/dataset/320/student+performance
We check missing values using:
A missing values heatmap that shows the distribution of missing data across columns.
suppressPackageStartupMessages(library(tidyverse))
library(ggplot2)
library(naniar)

missing_values <- data %>%
  summarise(across(everything(), ~ sum(is.na(.)))) %>%
  pivot_longer(cols = everything(), names_to = "Variable", values_to = "Missing_Count")

print(missing_values)
# A tibble: 33 × 2
Variable Missing_Count
<chr> <int>
1 school 0
2 sex 0
3 age 0
4 address 0
5 famsize 0
6 Pstatus 0
7 Medu 0
8 Fedu 0
9 Mjob 0
10 Fjob 0
# ℹ 23 more rowsvis_miss(data) +
theme_minimal() +
labs(title = "Missing Data Heatmap (Rows and Columns)") +
theme(axis.text.x = element_text(angle = 45, hjust = 0))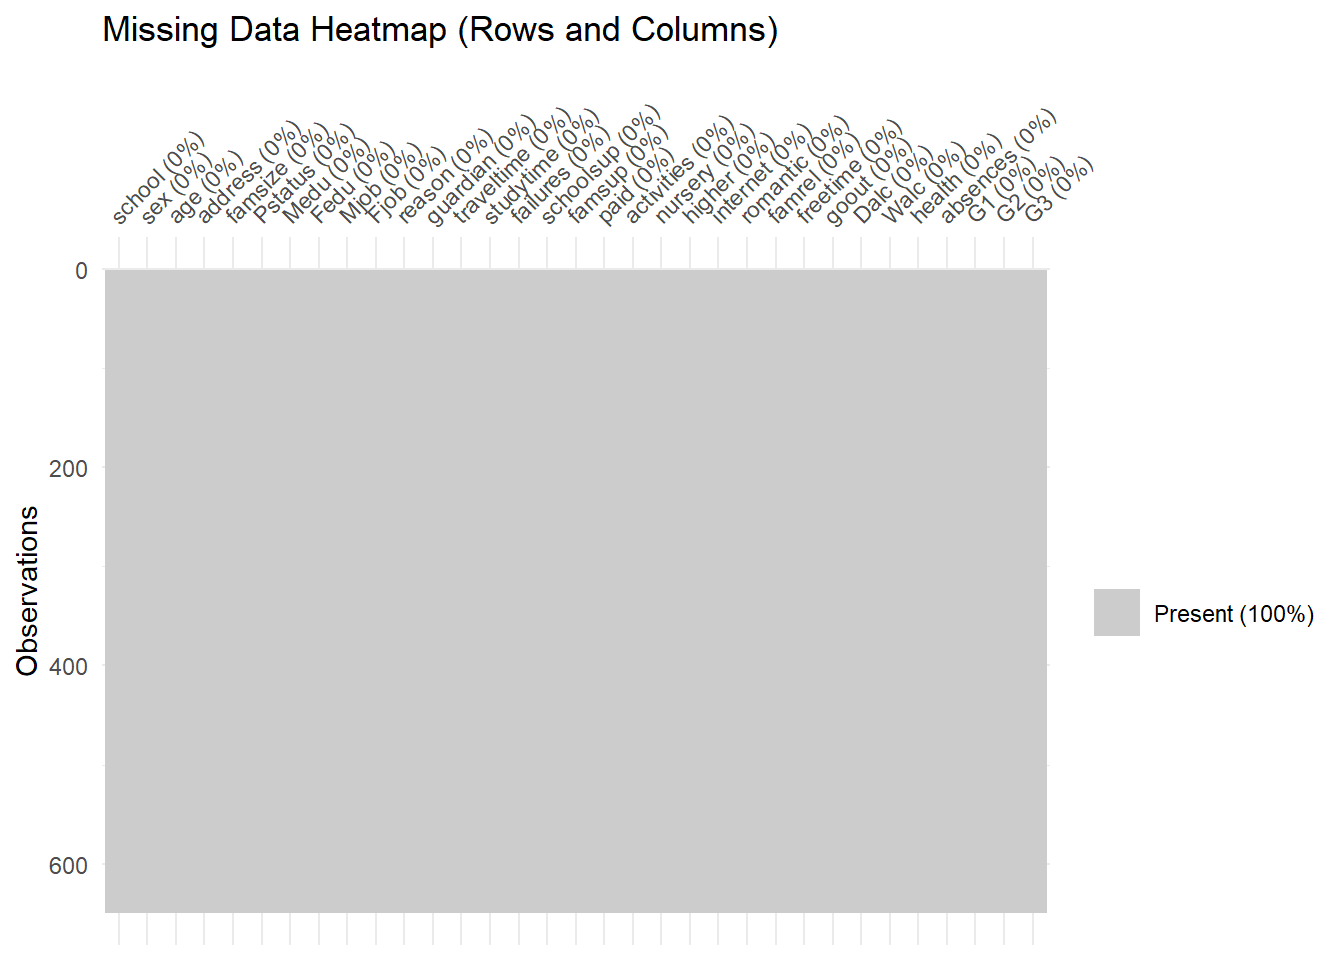
The dataset is complete with no missing values, which simplifies preprocessing. However, we will monitor data consistency and outliers in subsequent analyses.